
Picture two rival paper manufacturing companies. They’re based in the same city. Both businesses have a nationwide customer base. They’re roughly the same size. Each company has invested in a solid suite of transportation management tools to ensure its freight outlay is as cost-efficient as organizationally possible.
Company A is thriving while company B is barely scraping a profit.
There’s one critical difference between our hypothetical enterprises. Thanks to a strategically placed distribution center, company A can ship its products efficiently to its most critical customers. Customer B, meanwhile, is fighting a supply chain war of attrition against steep carrier rates, reduced delivery reliability, and slower delivery times.
Company A’s secret weapon was a freight operation that leveraged its supply chain’s center of gravity (COG).
Supply chain center of gravity (COG) analysis
A COG analysis identifies the optimal locations for one or more distribution centers. Drawing from a large dataset – typically comprising physical customer location, shipment count, weight and cost, carrier data, and freight type – a COG analysis builds up a detailed picture of distribution efficiency across your whole supply chain. From there, the analysis can extrapolate optimal points of distribution. By building your supply chain around optimal distribution points, based on enhancing critical requirements, you can lower your freight costs, improve delivery reliability and, in some instances, even extend your reach to new markets.
Let’s take a look inside a COG analysis IL2000 conducted for one client.
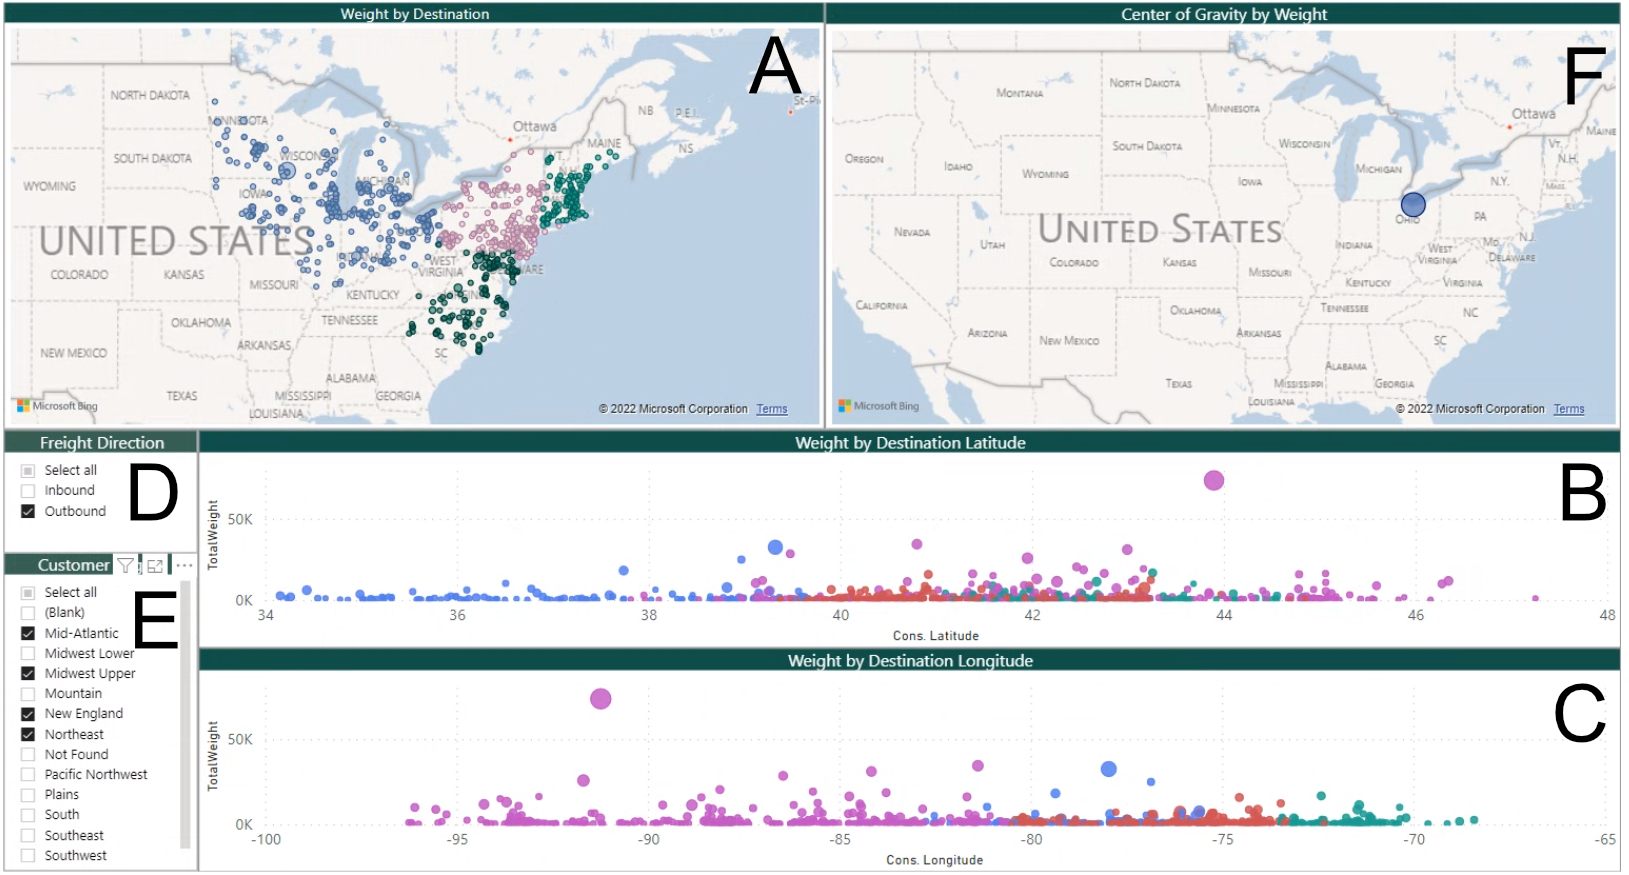 Figure 1.
Take a moment to familiarize yourself with the main moving parts of a COG analysis:
- Pane A displays a map of customer locations, color-coded by region.
- Panes B and C present these same customer data points, with the X axis plotting latitude and longitude respectively and the Y axis plotting shipment weight. The size of the data point indicates the total order count; more on that later.
- Panes D and E filter the data by type of shipment and location.
And finally, (and here’s where the money’s at) pane F reveals an optimal distribution location.
Behind the pretty graphics
Before we get to some use cases, there are a few features worthy of note here.
- Every analysis builds on a large dataset: You just can’t perform a meaningful COG analysis on the back of an envelope. To accurately arrive at that one dot you see in pane F, our BI team will typically analyze thousands of data points. This is a strategic COG analysis that’s going to actually help you understand your potential opportunities for improvement, not misplace it along with the mail.
- Results can be counterintuitive: Be prepared to be surprised. You might assume you can look at a cluster of points on a map and gain an instant “gut feel” for an optimal distribution point. Instinct leads people astray in an analysis like this because you’re looking at locations on a map and remembering total shipment counts. The critical factors in a COG analysis, weight and shipment cost, are far more difficult to intuit.
- There is no single “correct” result: Something you can’t ascertain from this graphic alone is the process that drives it. A COG analysis is typically highly interactive. Over the course of several sessions, we’ll slice your dataset up in different ways to identify several optimal location points, determined by everything from raw revenue to your growth strategy. Finding a final optimal distribution point, from a process standpoint, is like peeling back the layers of an onion.
Check out this case study for a hands-on example of how A COG analysis untangled one client’s shipping complexities.
COG analysis use cases
When might you consider working with IL2000 to perform a COG analysis on your supply chain?
Taming supply chain complexity
The further something has to travel, the more impact the weight of a shipment will have on its cost. But it isn’t that simple. Some regions are harder to reach. Some clients order in smaller weight units. Here’s a real-life example. Take a closer look at the two circled data points in Figure 2. Both points are similarly placed on the Y axis, meaning the client ships a similar weight of product to these customers. However, the blue company data point is much larger, meaning it has a much higher order count. Now, multiply the impact of these small but significant nuances across your whole supply chain. It’s close to impossible to weight these correctly without a COG analysis.
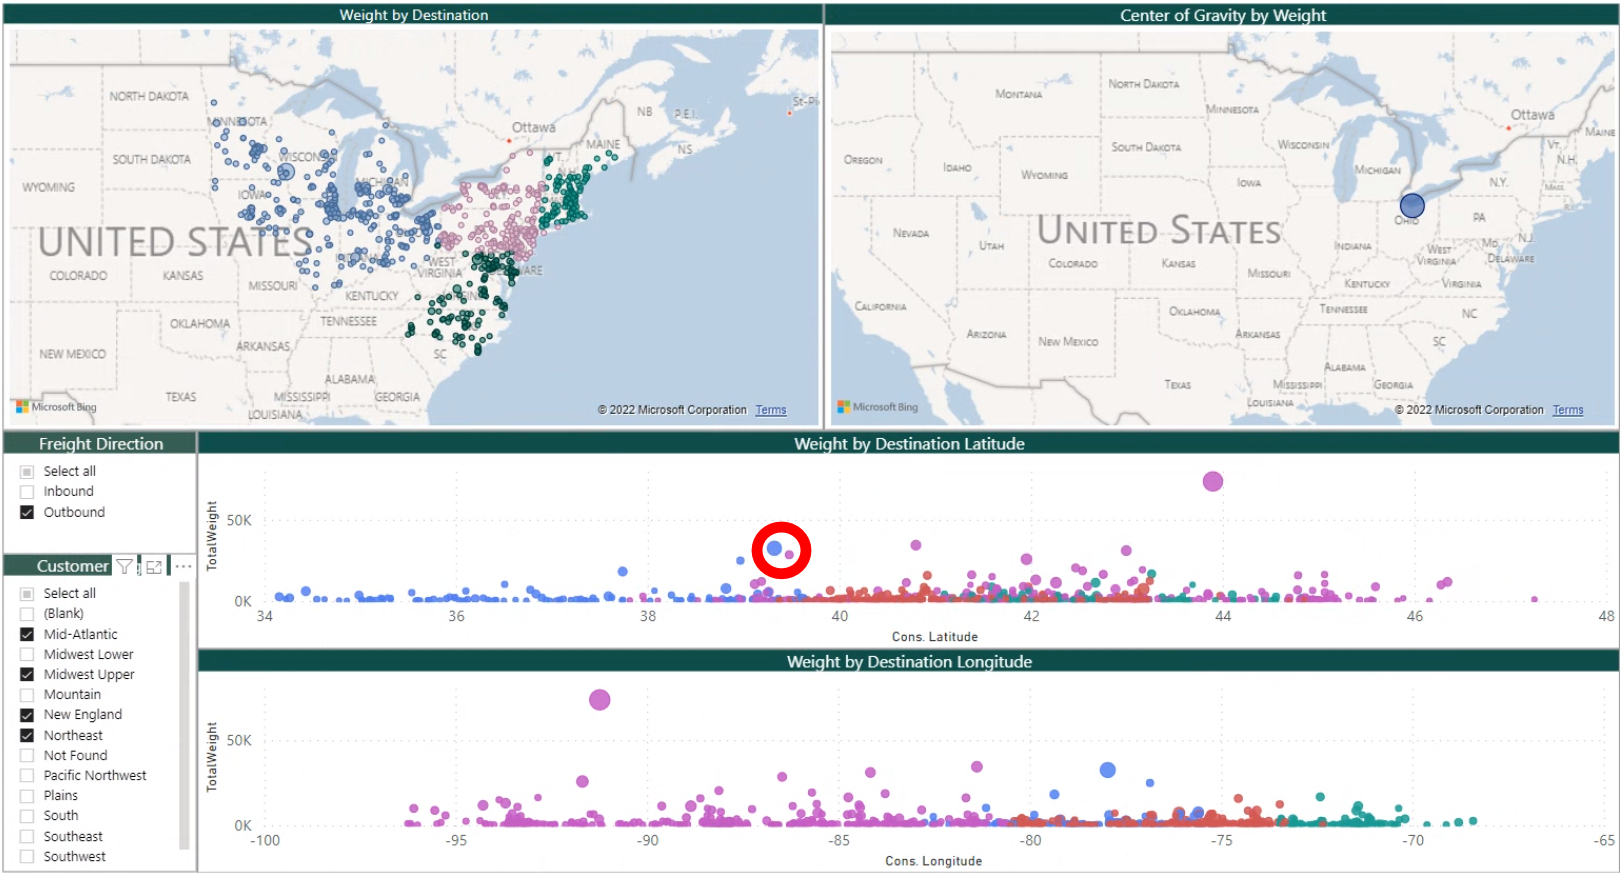 Figure 2.
Compensating for your logistics outliers
Nothing in life is perfect. With close enough examination, even the empirical impeccability of data can fall short of perfection. Outliers can create significant “turbulence” in a dataset. Figure 3 reveals a few of the more obvious outliers you may encounter. Your business may have an out-of-the-way customer location. Or you may have one customer who made an unusually large order, throwing off the accuracy of your dataset at a particular point in time. A COG analysis offers a data-driven approach to identifying and accounting for these and a host of similar problematic data points.
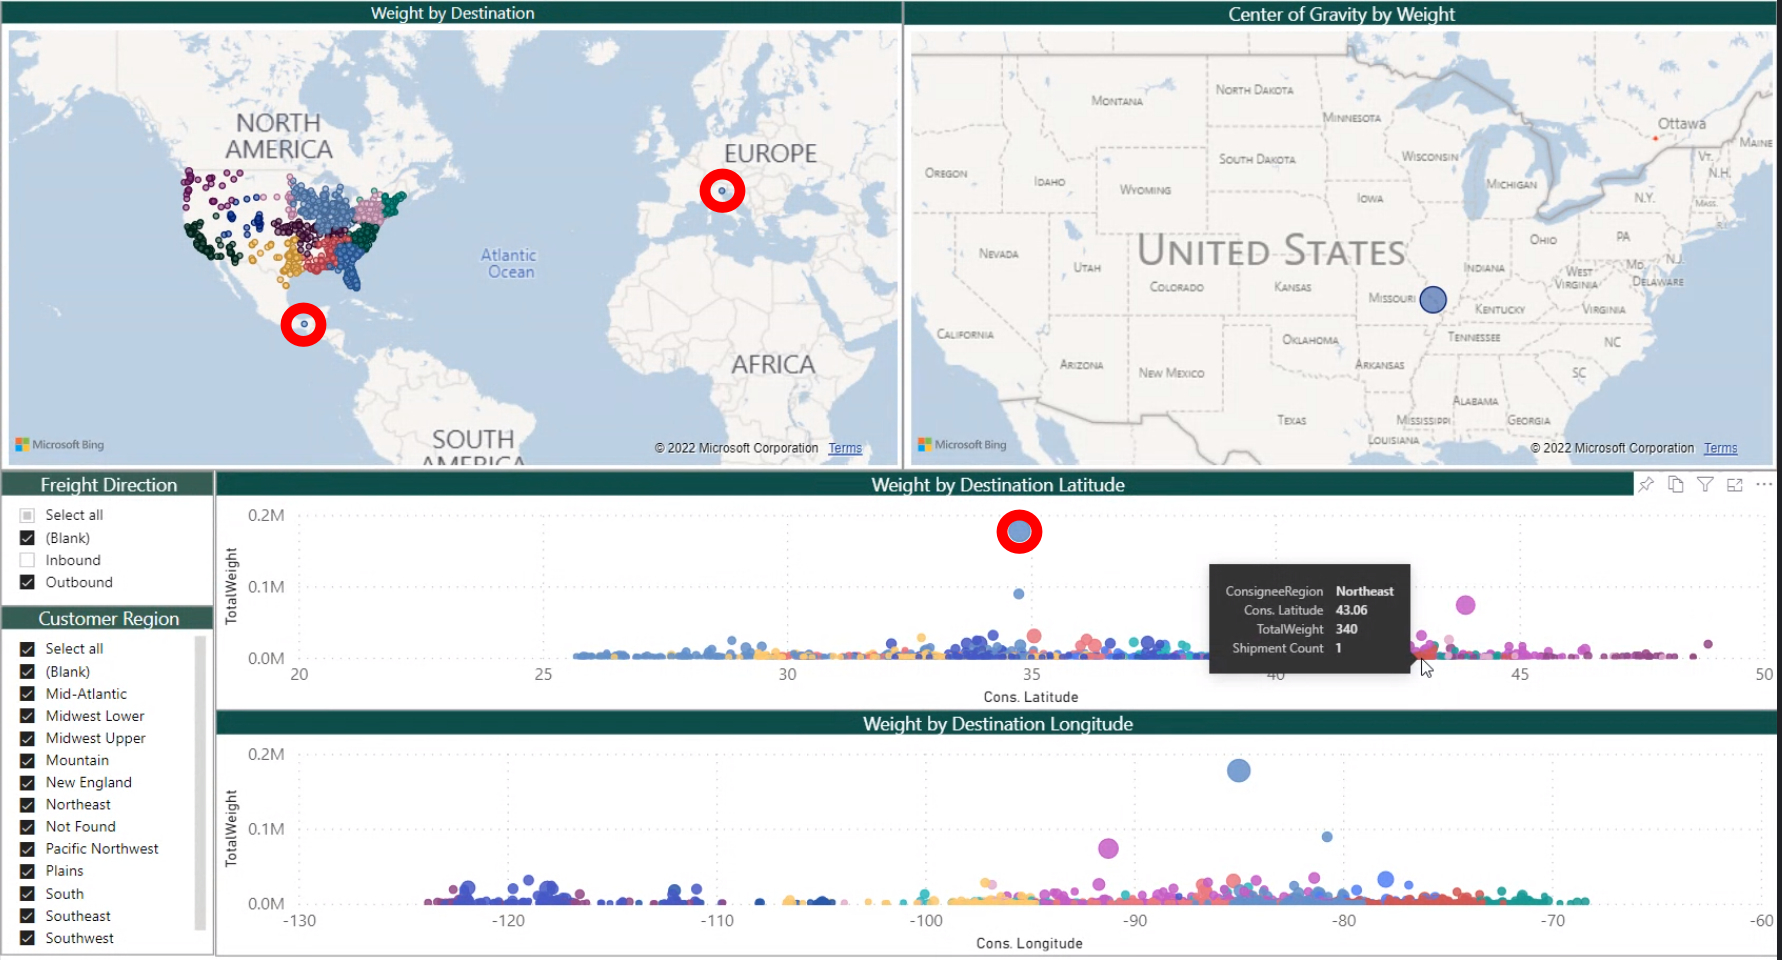 Figure 3.
Exploring and comparing scenarios
Your supply chain’s optimal distribution location depends on what you want to achieve. The interactive nature of a COG analysis allows you to gain deeper clarity on how different distribution locations impact your business model. Let’s take Figure 4 as an example and assume this client plans to develop a second distribution point. In the next 12 months, this client plans to expand into the midwestern market. The company also plans to launch a new kind of product, for which consumer demand is significantly higher on the West Coast.
Using a COG methodology, we can analyze these scenarios separately, and this is actually a core function within our business intelligence solution. The analysis considers a host of potential scenarios.
We can explore optimal distribution points for two geographical areas (likely pointing to somewhere in circle A). We can also ascertain where this company should distribute from for a product exclusively catering to one segment of its customers (in this case, somewhere in zone B). A COG analysis allows you to link your supply chain decisions to how you want your company to grow.
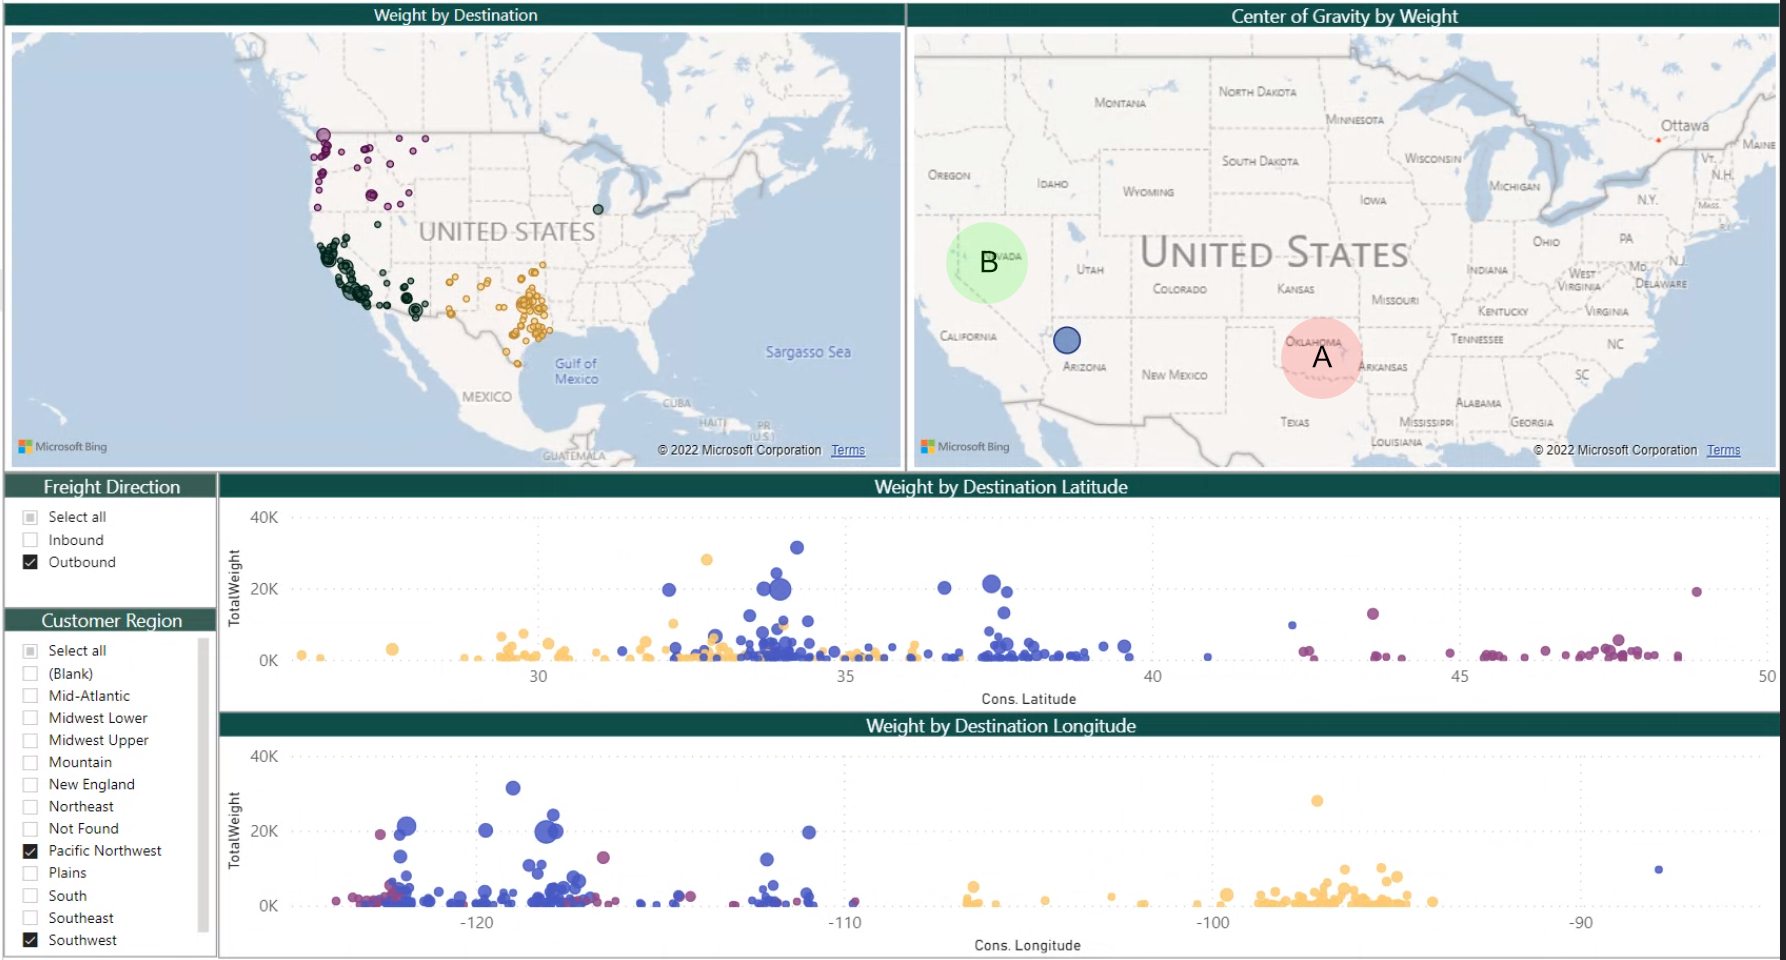 Figure 4.
The unbearable weight of being (in the wrong place)
Your supply chain is far more likely to founder if it’s weighed down by a suboptimal point of distribution These critical vulnerabilities are the weaknesses within your supply chain, and despite the strength of your whole supply chain, it could lead to problems down the proverbial road. At the least, you’ll need to deal with higher freight costs, slower delivery times, and greater uncertainty. Choosing a better place from which to distribute is a critical decision, one that should be driven by hard data and expert analysis that will enable true command and control over your shipments, not the other way around.
X marks the spot. Find it!
Talk to IL2000 about having a center of gravity analysis conducted for your supply chain. We can help you weigh your options and guide you to a smart decision.